Module 4 Lab 1 - Visualizer
Overview
In this lab you’re going to learn about Anypoint Visualizer and see how this tool can help reduce meantime to identification and mean time to resolution, ensuring resilient operations.
Anypoint Visualizer provides a real-time, graphical representation of the APIs, and Mule applications that are running and discoverable. You can use the graph to explore your application network and view multiple metrics, including throughput, response time, and errors for each node in your application network. You will see how easy it is to view the APIs affected in case you need to update an API, or see if there is one that is failing.
You can see that the APIs are separated in three different layers Experience, Process and System.
Step 1: Create your View
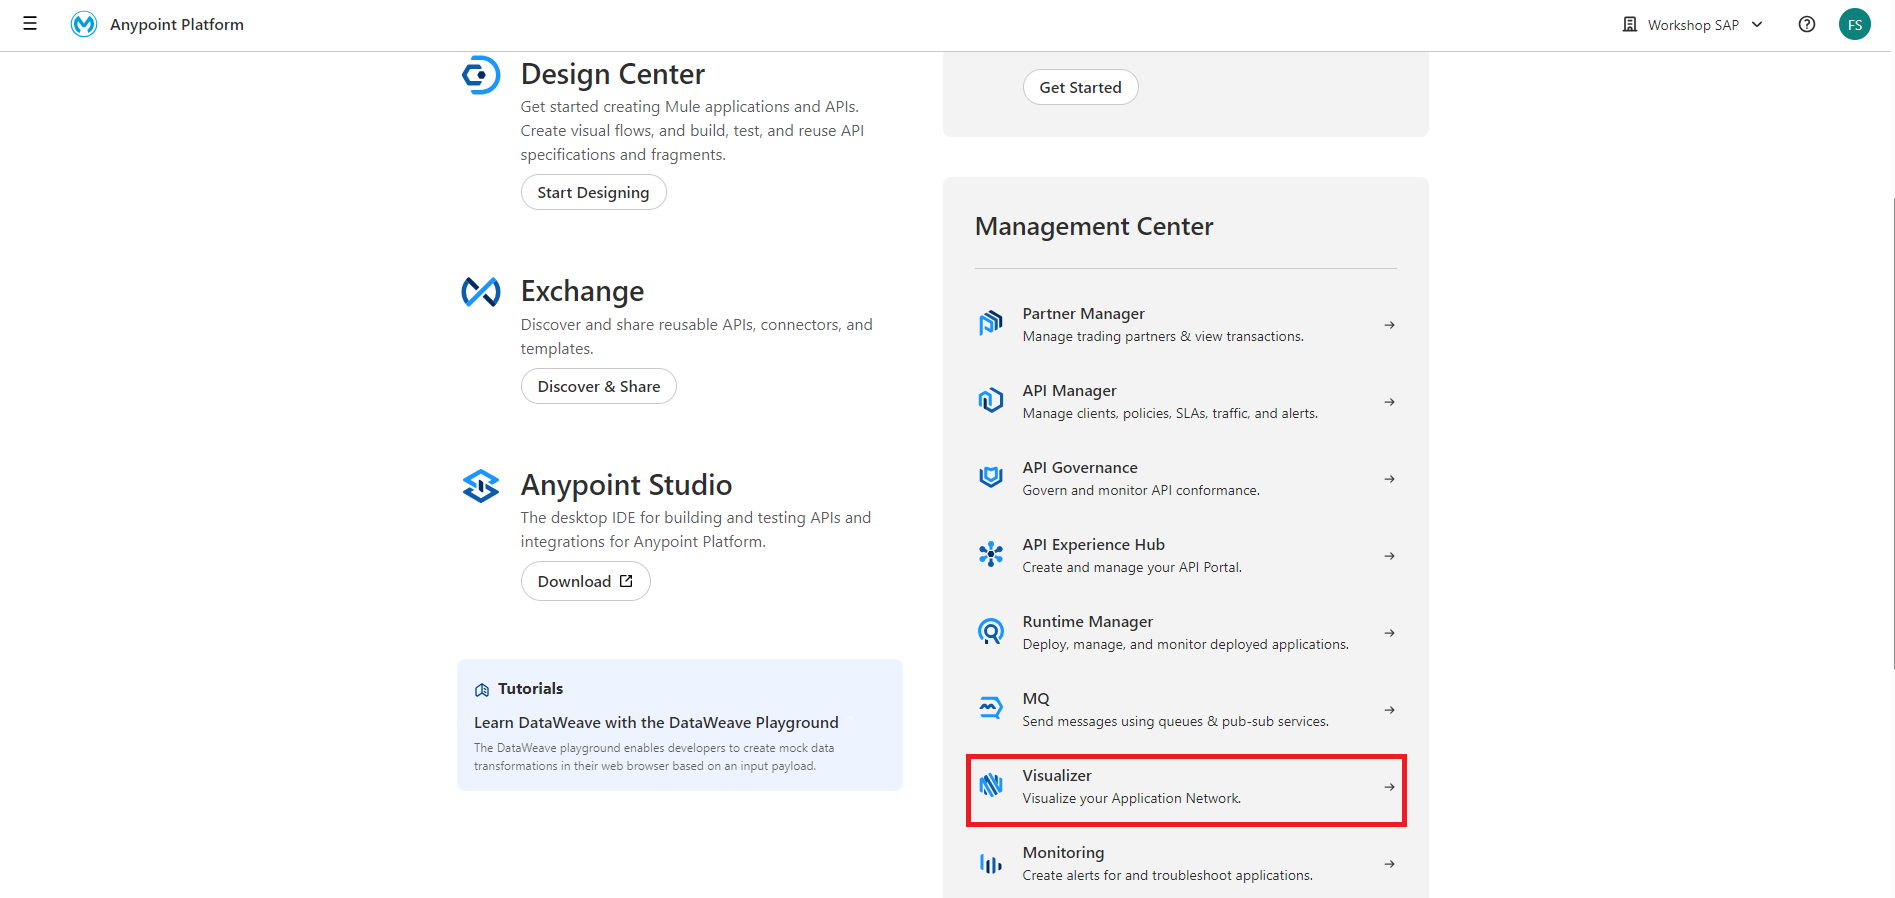
Navigate to the Anypoint Platform and click on Visualizer

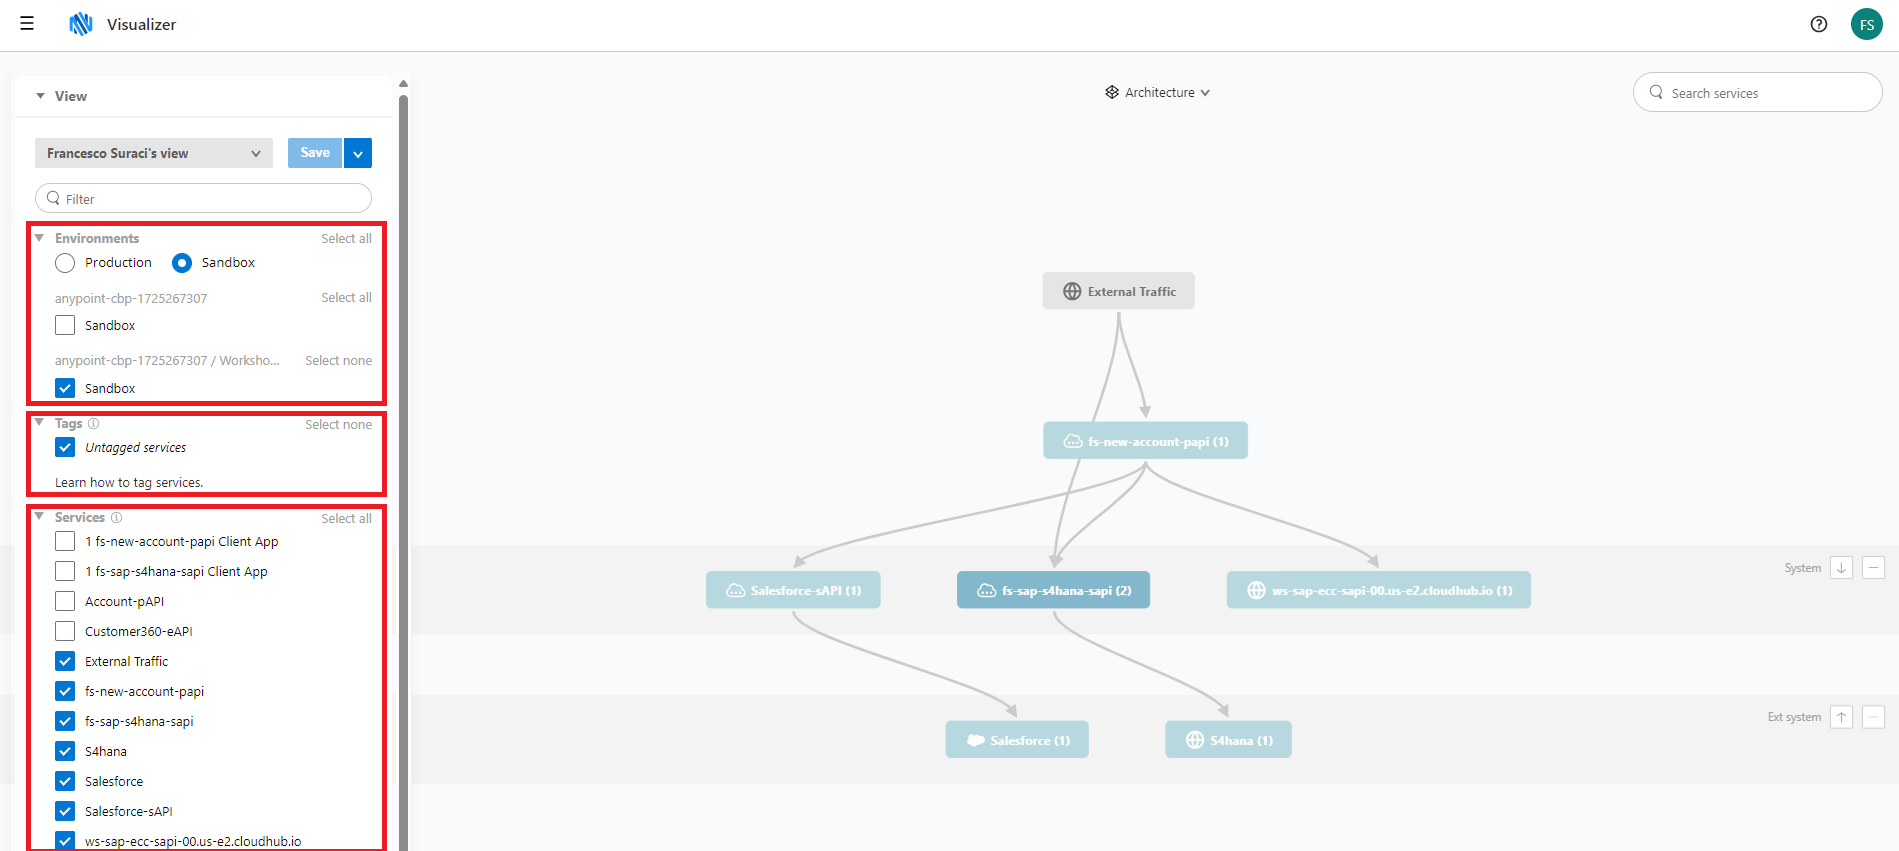
You can now select the Environments and Business Group where your applications are deployed. In our case this is:
-
Sandbox (or Production)
-
Workshop Group Name (differs per workshop)
Now you can select your deployed APIs, your registered Application and it will show you your own Application Network

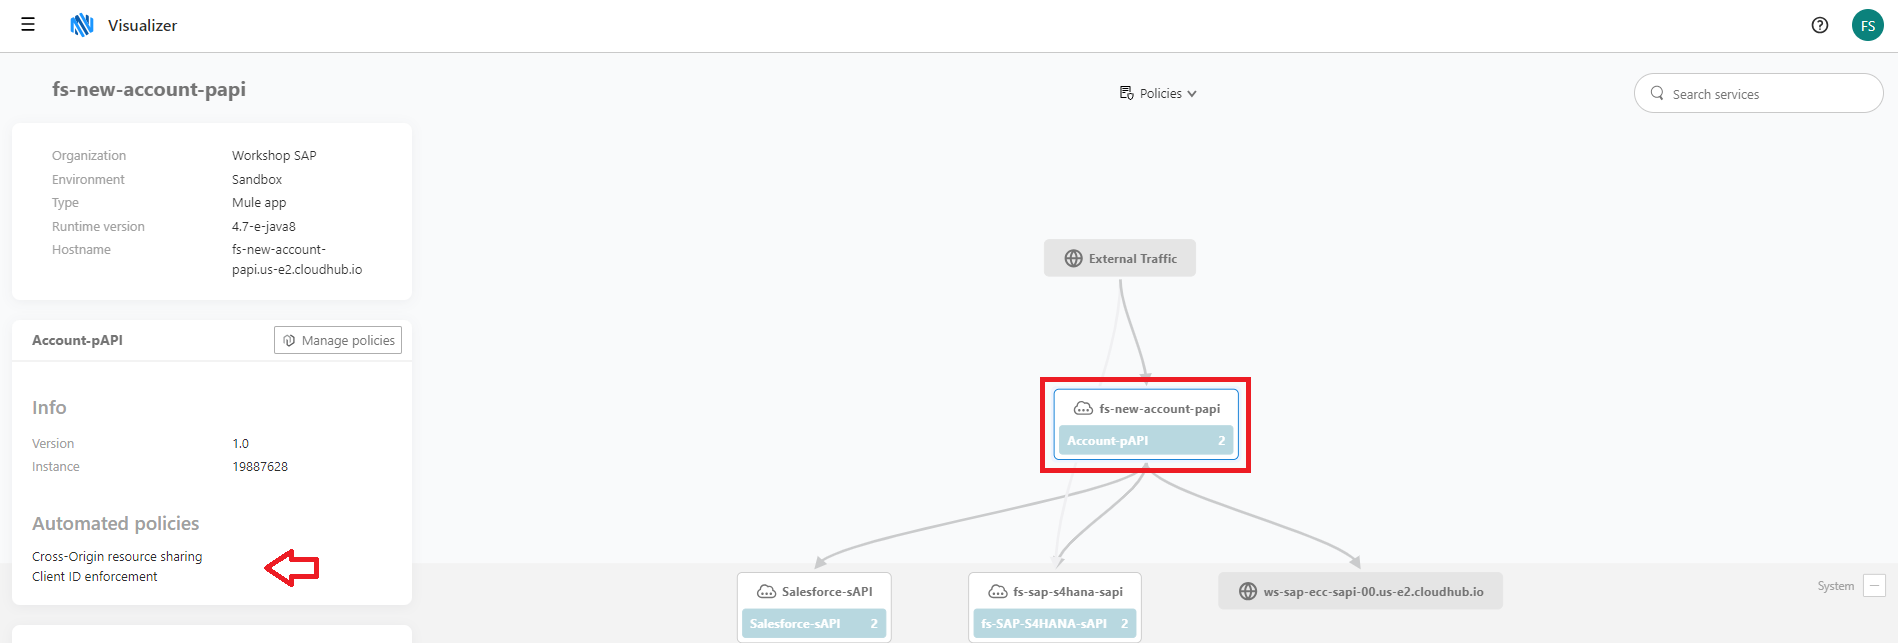
With the dropdown in the center of the screen you can switch your view between
-
Architecture
-
Troubleshooting
-
Policies

Troubleshooting
Within Troubleshooting you can switch between different metrics of your network
-
Inbound Connections
-
Avg Response Time
-
Avg Throughput
-
Failures
-
Avg CPU Utilization
-
Avg memory utilization
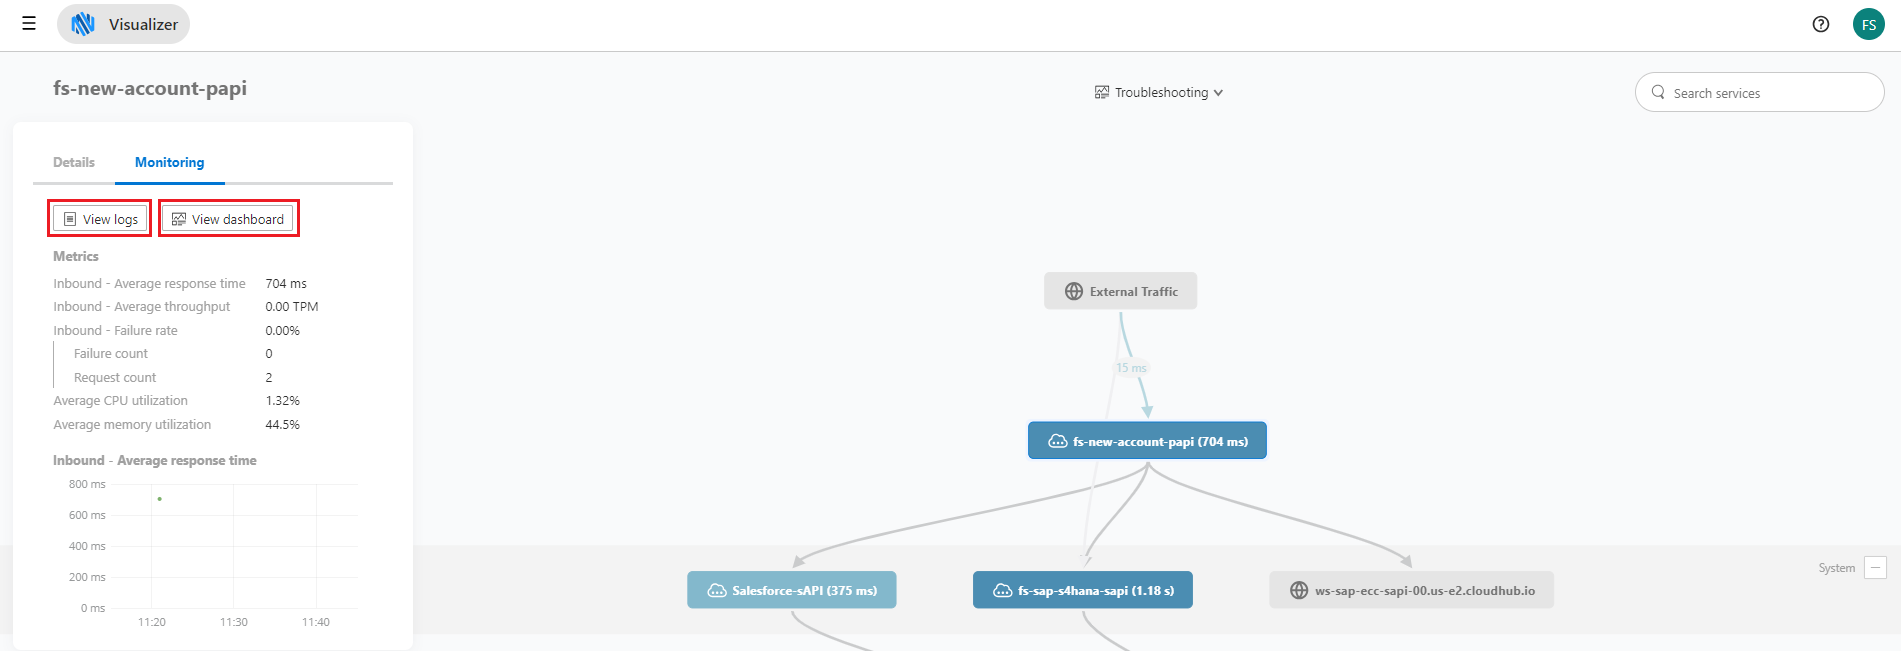
For example with Failures, you can immediately locate errors in your network and investigate by drilling into logs and dashboards in Anypoint Monitoring.
For instance click on one of your APIs in the network. You will see that this API is now in our focus and on the left hand side, the details of this API will appear. Click on the tab Monitoring
Within the Monitoring tab you can directly navigate to
-
Applications Logs
-
API Monitoring

Summary
You’ve successfully completed all 4 modules of this workshop. The workshop has provided you hands-on experience with connecting with SAP using a variety of methods provided through the MuleSoft Anypoint Platform.
Along the way, you’ve learned how to create API specification in API Designer. You’ve taken those specifications and imported them into Anypoint Studio where you learned how to quickly and easily connect to SAP ECC and SAP S/4HANA through visual drag-and-drop design versus coding.
Lastly, to save time, you’ve reused pre-configured examples from Anypoint Exchange and quickly deployed those into CloudHub - a global, fully-managed, multi-tenanted, secure, and highly available platform for APIs and integrations.


